Top 3 Candlestick pattern for Intraday Trading: Candlestick charts are technical analysis tool that is used by most of the traders to predict the future movement of the market and different candlestick patterns help traders to understand the movement of the stock.
In this blog, we will discuss the top 3 candlestick patterns that are most useful for intraday traders.
#1. DOJI:
The Doji is a candlestick formation that signifies indecision between bulls and bears. A Doji is generally found at the top and bottom of trends and thus it can be considered as a signal of a possible reversal of security’s price direction.
A Doji is formed when the opening price of a stock is equal to the closing price. A long-legged Doji is called as a ‘Rikshaw Man”. As compared to Doji, Rikshaw Man Doji has longer upper and lower shadows.
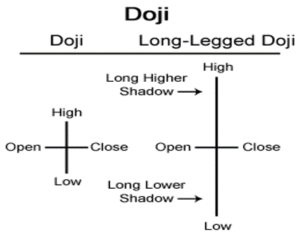
The two important varieties of the Doji formation are:
A⇒ Dragonfly Doji
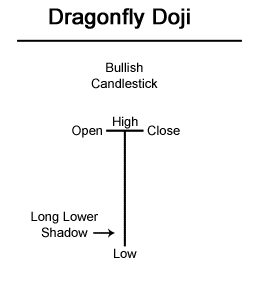
The Dragonfly Doji is generally interpreted as a bullish reversal candlestick pattern that mainly occurs at the bottom of a downtrend. This type of Doji created when the Open, high, and close are exactly the same price and the most important part of this Doji id long lower shadow.
B⇒ Gravestone Doji
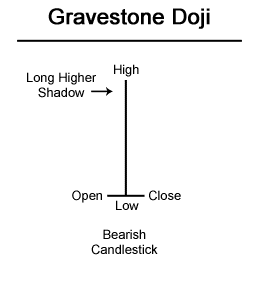
The Gravestone Doji is typically interpreted as a bearish reversal candlestick pattern that mainly occurs at the top of an uptrend. It created when the open, low and close are the same or about the same price and the gravestone Doji is the long upper shadow.
#2. Hammer:
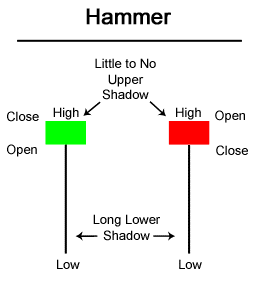
Hammer is one of the most powerful candlestick charting patterns. This hammer pattern is generally, indicates a reversal from the bearish trend. When a security trades at a lower price than its opening, but it rallies within the period to close near opening price – hammer pattern occurs.
Hammer pattern can be identified easily, in this type the lower shadow is at least twice the size of the real body.
When the high and the close are the same of the candle then it is called as a bullish hammer and it is considered as a stronger formation because the bullish hammer is able to reject the downtrend and able to push price upwards.
“The worse a situation becomes the less it takes to turn it around, the bigger the upside.” George Soros
When the open and high are the same of the hammer then it is called as a bearish hammer, and the bearish candle is able to reject the uptrend and also has a stronger formation that can push price downwards.
#3. The Engulfing Pattern:
The engulfing pattern is the reversal pattern. It is the inverse of the harami pattern, which consists of two candles. The first candle is being a relatively short candle with a short real body and the second one is being a relatively large candle with a big real body. The large candle engulfs the real body of the first candlestick.
“I see a tremendous imbalance in the world. A very uneven playing field, which has gotten tilted very badly. I consider it unstable. At the same time, I don’t exactly see what is going to reverse it.” George Soros
There are two types of Engulfing Pattern that is Bullish Engulfing and Bearish Engulfing Pattern.
A⇒ Bullish Engulfing Pattern
Bullish Engulfing pattern is similar to the reversal candlestick pattern which is bullish in nature and forms at the end of a downtrend. The bullish engulfing pattern is made of two candles in which the first one is bearish and the second one is bullish in nature.
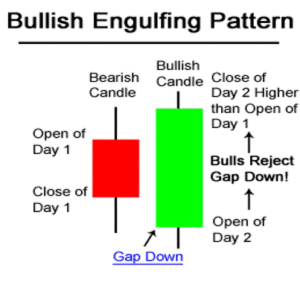
Bullish Engulfing pattern forms major bullish reversal candlestick pattern, in which you need to watch other things while analyzing. Which are,
- There has to be a clear (major or minor) downtrend.
- The first candle is red (bearish) candle indicating an ongoing downtrend and the second candle is always a strong green (bullish) candle.
- The second-day green candle’s real body engulfs the first-day red candle’s real body.
B⇒ Bearish Engulfing Pattern
Bearish Engulfing pattern is the reversal candlestick pattern, bearish in nature and it appears at the end of an uptrend. The bearish engulfing pattern is consisting of two candles in which the first one is bullish and the second one is bearish in nature.
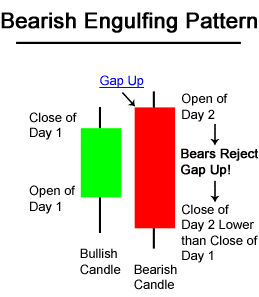
Bearish Engulfing pattern forms a major bearish reversal candlestick pattern. You need to keep a few things in mind while analysis it. Which are,
- There has to be a clear (major or minor) uptrend.
- The first candle is green (bullish) candle signifying an ongoing uptrend and the second candle is always a strong red (bearish) candle.
- The second red candle’s real body engulfs the first green candle’s real body.
By, Virtueticks


